Managing Data with Edit Domain
Importing data into Orange is easy. File, import, and voila, your data is here. But what about if you want to rename a variable, change it's type or edit labels? Edit Domain to the rescue!
First of all, what is 'domain'. Domain is like a metadata of your data - it describes column names, column types (categorical, numeric, string, datetime), and values for categorical variables. You will come across domain everywhere in Orange, because Orange's table (Orange.data.Table for programmers) is nothing without it.
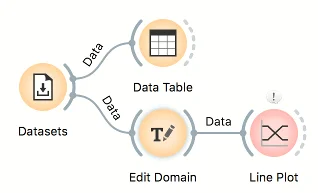
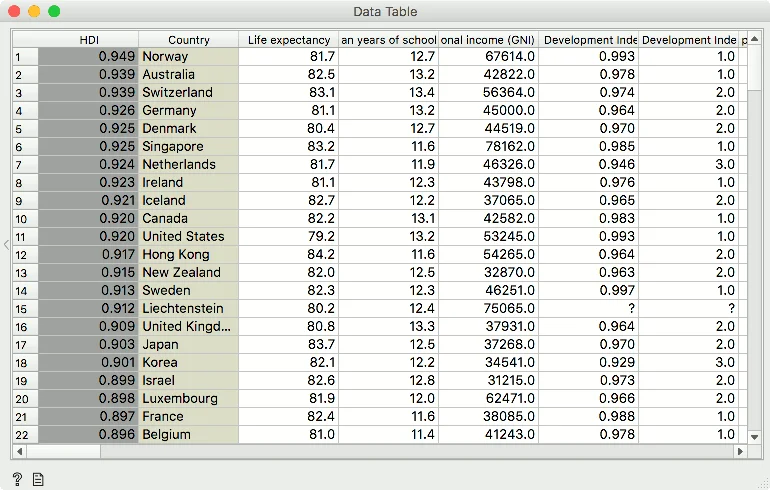
Edit Domain helps you organize the domain of your data. Let us use Datasets widget and load HDI, a dataset of human development index for most countries in the world. We have 188 rows (countries) and 66 features (index variables).
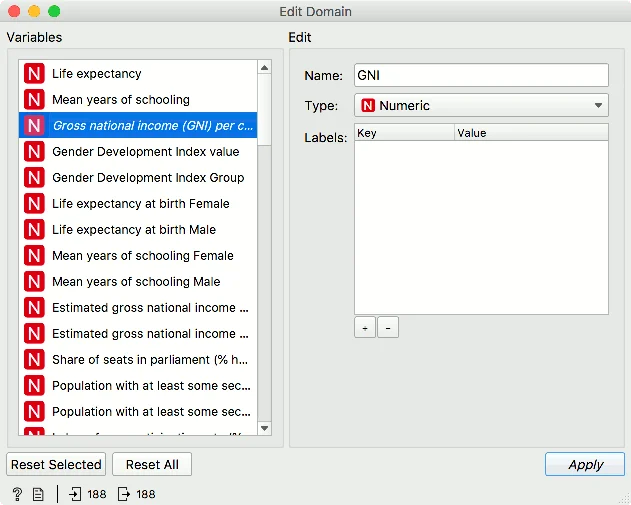
Now, let us check the domain in Edit Domain. First of all, our variable names are long, so we can make them shorter with Edit Domain. Select, say, Gross National Income (GNI) per capita and rename it to GNI. Simple! If you are unhappy with the change, simply press Reset Selected at the bottom of the widget.
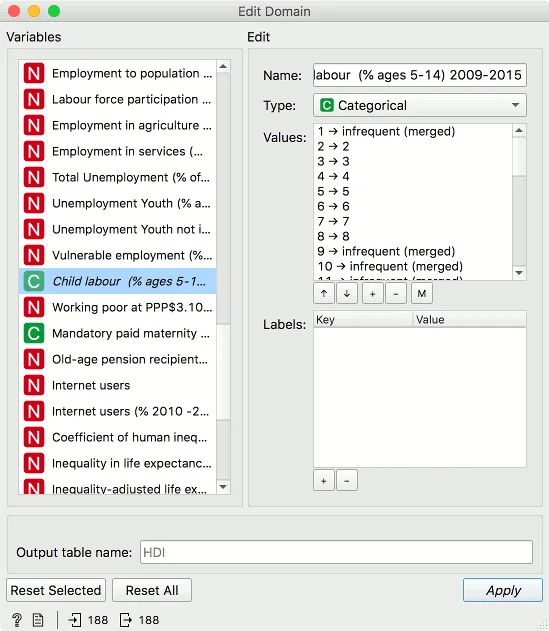
Scroll down and check the rest of the variables. We have two categorical variables in the data, child labour and maternity leave. Let us check Child labour (% ages 5-14) 2009-2015 and rename it first to Child labour. You can see the variable has many values, from 1 to 47. How about we merge the less frequent values into one?
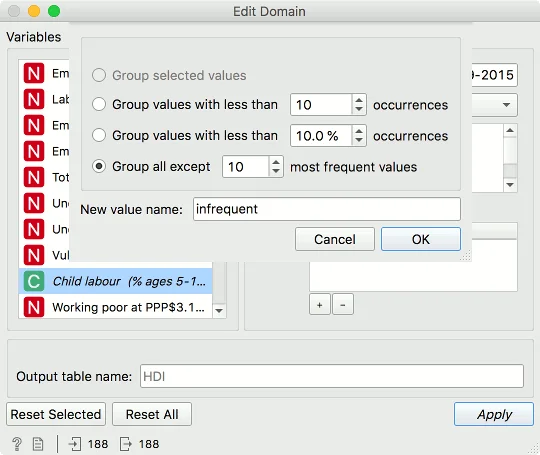
Press M on the right side of the widget and a new window will pop up. There are several ways to group less frequent variables, but let's go with merging all but top 10 most frequent values. Let us also change the label of these values from other to infrequent.
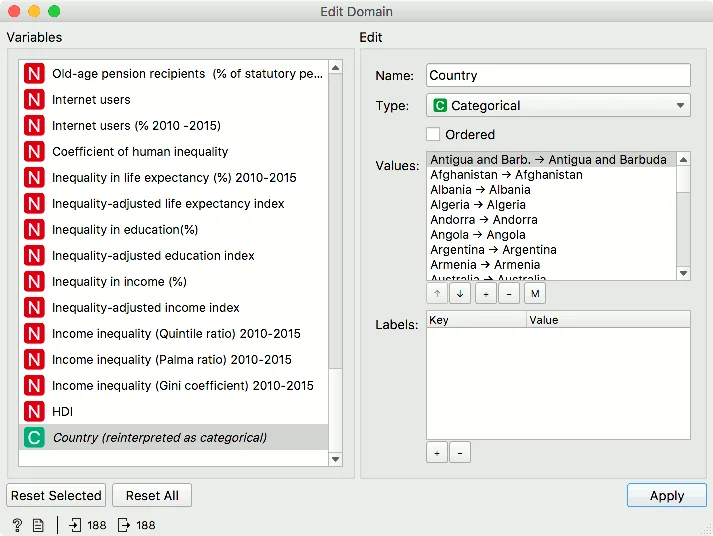
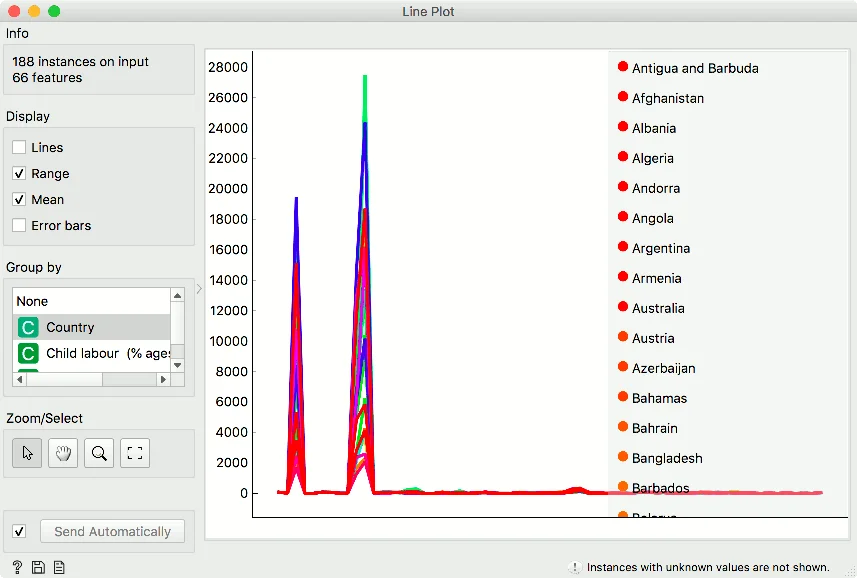
Finally, we will select Country from the list and set it as a categorical variable. Click on Type drop down and select Categorical. This will reinterpret the variable according to the selected type. Now you can also see the values of the reinterpreted variable. Double-click Antigua and Barb. and rename it to Antigua and Barbuda. You can use up and down arrows to change the order of the variable. Let us push Antigua and Barbuda to the top. The order will be evident in, say, visualizations and their legends. If you connect Line Plot to Edit Domain and set Group by to Country, Antigua and Barbuda will have a long name and will be placed at the top.
Edit Domain is a great widget to organize your data. See documentation for other great widgets, such as Create Class or Feature Statistics.